The Claim — and Why We Tested It in Pune
I came across a post in which Ar. Hafeez Contractor Sir said that housing in Mumbai will not become affordable unless the city allows an FSI of at least 8. I have great respect for Ar. Hafeez Contractor and for what his work has contributed to Indian cities. This article is not a rebuttal. It is a study prompted by his statement, to see what the idea does to the numbers of a real project.
The idea is appealing: more floor space on the same land should spread the land cost thinner and bring the price per square foot down.
Before you read:
- This is a study, not a project feasibility. An 8 FSI case for residential development does not exist under UDCPR today.
- Fire-related challan and fire premium are not calculated in either scenario, and a few other government charges are not included.
- Aviation height limits are not applied, deliberately, so that the FSI question can be studied on its own.
- Both scenarios use the same plot of 5,000 sq.m., the same ASR of ₹40,000 per sq.m. and the same selling rate of ₹13,000 per sq.ft.
- TOD and BRT zones are not considered. They are city-specific and do not apply across the whole UDCPR area.
- Corrections and advice from architects, developers and other experts are welcome. They will make the study better.
Mumbai is governed by DCPR 2034, which has its own FSI architecture. Rather than force Mumbai's rules into a different framework, we asked a parallel question in the regulation that FSI Atlas models end to end — UDCPR 2020:
The question
If UDCPR allowed 8 FSI for housing, would homes in Pune actually become cheaper — and by how much?
The direction of the answer carries over to Mumbai. The exact numbers would not, and we will not pretend otherwise.
The Ceiling Today — 4.8 FSI for Housing
For a residential plot in a non-congested area of a Municipal Corporation, the most UDCPR allows is reached on roads of 30 m and wider. Table 6-G gives:
| Component | FSI |
|---|---|
| Basic FSI | 1.10 |
| Premium FSI | 0.50 |
| TDR | 1.40 |
| Maximum permissible FSI (cap) | 3.00 |
| Ancillary Area FSI — residential, 60% of 3.00 | 1.80 |
| Buildable residential FSI | 4.80 |
Higher figures do exist under UDCPR, but not for ordinary housing. The CBD provision in Regulation 7.13 allows up to 5.0 FSI including permissible FSI, with 80% ancillary on top, but it is written for commercial user: residential use is limited to 30% of the normally permissible FSI, and the additional premium FSI under 7.13 cannot be used for residential development. We have therefore left the CBD route out and studied a purely residential plot.
We have also not considered TOD or BRT zones. They allow more FSI along specific transit corridors, but they are city-specific and do not apply across the whole UDCPR area. So for housing, 4.8 is the ceiling, and 8 FSI would need a rule change.
What It Would Take to Reach 8
With 60% ancillary for residential use, 8.00 needs 5.00 before ancillary (8.00 ÷ 1.60). If Premium FSI and TDR stay where they are, the whole increase has to come from Basic FSI:
| Component | Today (road 30 m+) | Proposed (8 FSI) |
|---|---|---|
| Basic FSI | 1.10 | 3.10 |
| Premium FSI | 0.50 | 0.50 |
| TDR | 1.40 | 1.40 |
| Cap before ancillary | 3.00 | 5.00 |
| Ancillary FSI (60%) | 1.80 | 3.00 |
| Buildable FSI | 4.80 | 8.00 |
| Two changes, not one. Raising Basic FSI to 3.10 achieves nothing unless the 3.00 cap in the road-width table is lifted to 5.00 at the same time. | ||
We raised Basic FSI rather than Premium FSI or TDR because Basic FSI carries no premium. The section after the area statement shows what happens to the price if the same extra floor space is sold as premium FSI or TDR instead.
The Study — Same Plot, Same Rates
Both scenarios were run through the FSI Atlas feasibility engine with identical inputs. Only the FSI changes. For how each cost head is built up, see our guide to real-estate feasibility studies.
| Input | Value (both scenarios) |
|---|---|
| Location | A residential area within Pune Municipal Corporation, non-congested |
| Plot area | 5,000 sq.m., no road-widening or reservation deductions |
| Use | 100% residential, outright purchase |
| ASR (land rate) | ₹40,000 per sq.m. — the same in both |
| Land cost | ₹20.00 crore base (₹21.90 crore with stamp duty, registration and brokerage) |
| Selling rate | ₹13,000 per sq.ft. of saleable area, 45% loading |
| Premium, ancillary and TDR utilisation | 100%, Slum TDR 30% of total TDR |
| Zone | Standard — no TOD, BRT or CBD provisions applied |
| Project timeline | 24 months (4.8 FSI) and 40 months (8 FSI) |
| Parking | Ground + 2 podiums (4.8 FSI); Ground + 4 podiums (8 FSI), as per UDCPR parking norms |
Deliberately left out. Because this is a study, aviation height limits are not applied. Parts of Pune fall under airport and NDA height restrictions that would stop either building long before its FSI is used up. Fire-related charges and fire premium are also not included. Both would add cost to the taller 8 FSI building.
Area Statement — 24,000 vs 40,000 sq.m.
| Item | 4.8 FSI (sq.m.) | 8 FSI (sq.m.) |
|---|---|---|
| Basic FSI | 5,500 | 15,500 |
| Premium FSI | 2,500 | 2,500 |
| TDR (Slum 2,100 + Regular 4,900) | 7,000 | 7,000 |
| Total before ancillary | 15,000 | 25,000 |
| Ancillary FSI (60%) | 9,000 | 15,000 |
| Total built-up area | 24,000 | 40,000 |
| FSI consumed | 4.80 | 8.00 |
| Saleable area (45% loading) | 3,18,399 sq.ft. | 5,30,665 sq.ft. |
| Inclusive Housing required (20% of Basic FSI) | 1,100 | 3,100 |
Only one row changes between the two columns: Basic FSI, from 5,500 to 15,500 sq.m. Premium FSI and TDR are identical. Everything else in the 8 FSI case follows from that one row.
Note also the last row. Inclusive Housing under UDCPR is 20% of Basic FSI, so raising Basic FSI to 3.10 nearly triples the affordable-housing obligation, unless that rule were revised as well. For affordability, this is a feature rather than a bug. For the developer, it is floor space that does not sell at market price.
Why it has to be Basic FSI
The same 40,000 sq.m. could in theory be reached by keeping Basic FSI at 1.10 and selling the extra 2.00 FSI (10,000 sq.m.) as Premium FSI or as TDR. At the same selling rate of ₹13,000, the three routes give very different results:
| Extra 2.00 FSI comes as… | Extra cost | Total cost | Profit | ROI |
|---|---|---|---|---|
| Basic FSI (no premium) | — | ₹303.55 Cr | ₹395.98 Cr | 130.4% |
| Premium FSI (35% of ASR) | +₹14.00 Cr | ₹317.55 Cr | ₹381.98 Cr | 120.3% |
| TDR (130% of ASR) | +₹52.00 Cr | ₹355.55 Cr | ₹343.98 Cr | 96.7% |
| For reference, the 4.8 FSI project returns 113.4%. Sold as premium, a large part of the gain goes to the authority. Bought as TDR, the 8 FSI project returns less than today's 4.8 FSI project, so there is nothing left to pass on to buyers. Higher FSI can help the buyer only when it comes as Basic FSI. | ||||
Government Charges — Up Only 11%
Floor area grows by 67%, but government charges grow by only 11%. The extra Basic FSI attracts development charges and cesses, but no premium, and the TDR and premium FSI bill stays the same.
| Charge (ASR ₹40,000/sq.m.) | 4.8 FSI | 8 FSI |
|---|---|---|
| TDR (Slum + Regular, at 130% of ASR) | ₹36.40 Cr | ₹36.40 Cr |
| Premium FSI (35% of ASR) | ₹3.50 Cr | ₹3.50 Cr |
| Ancillary FSI premium (15% of ASR) | ₹5.40 Cr | ₹9.00 Cr |
| Development charges | ₹1.92 Cr | ₹3.20 Cr |
| Scrutiny, land development, cess and other charges | ₹0.39 Cr | ₹0.57 Cr |
| Total government charges | ₹47.61 Cr | ₹52.67 Cr |
| Per sq.ft. of saleable area | ₹1,495 | ₹993 |
The Feasibility — Side by Side
| At ₹13,000/sq.ft. | 4.8 FSI | 8 FSI | Change |
|---|---|---|---|
| Revenue | ₹417.35 Cr | ₹699.53 Cr | +68% |
| Land (incl. stamp duty etc.) | ₹21.90 Cr | ₹21.90 Cr | — |
| Construction (incl. parking structure) | ₹89.22 Cr | ₹169.53 Cr | +90% |
| Government charges | ₹47.61 Cr | ₹52.67 Cr | +11% |
| Marketing & sales | ₹27.67 Cr | ₹44.54 Cr | +61% |
| Consultants and administration | ₹9.14 Cr | ₹14.91 Cr | +63% |
| Total cost | ₹195.54 Cr | ₹303.55 Cr | +55% |
| Developer's profit | ₹221.81 Cr | ₹395.98 Cr | +79% |
| Return on cost | 113% | 130% | |
| Timeline | 24 months | 40 months | +16 months |
| Parking structure | Ground + 2 podiums | Ground + 4 podiums | +2 levels |
Timeline — 24 Months vs 40 Months
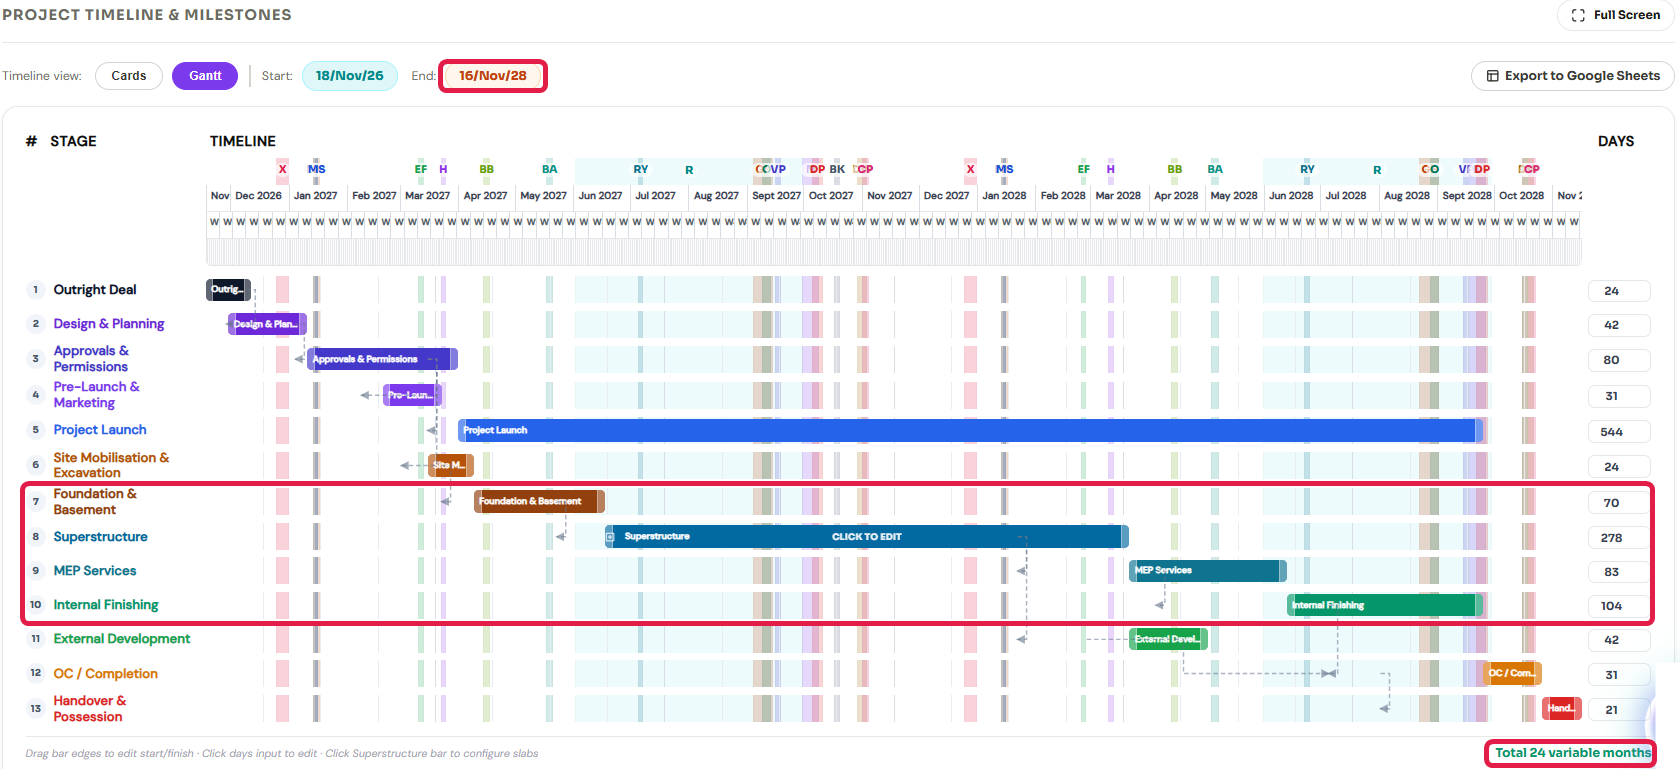
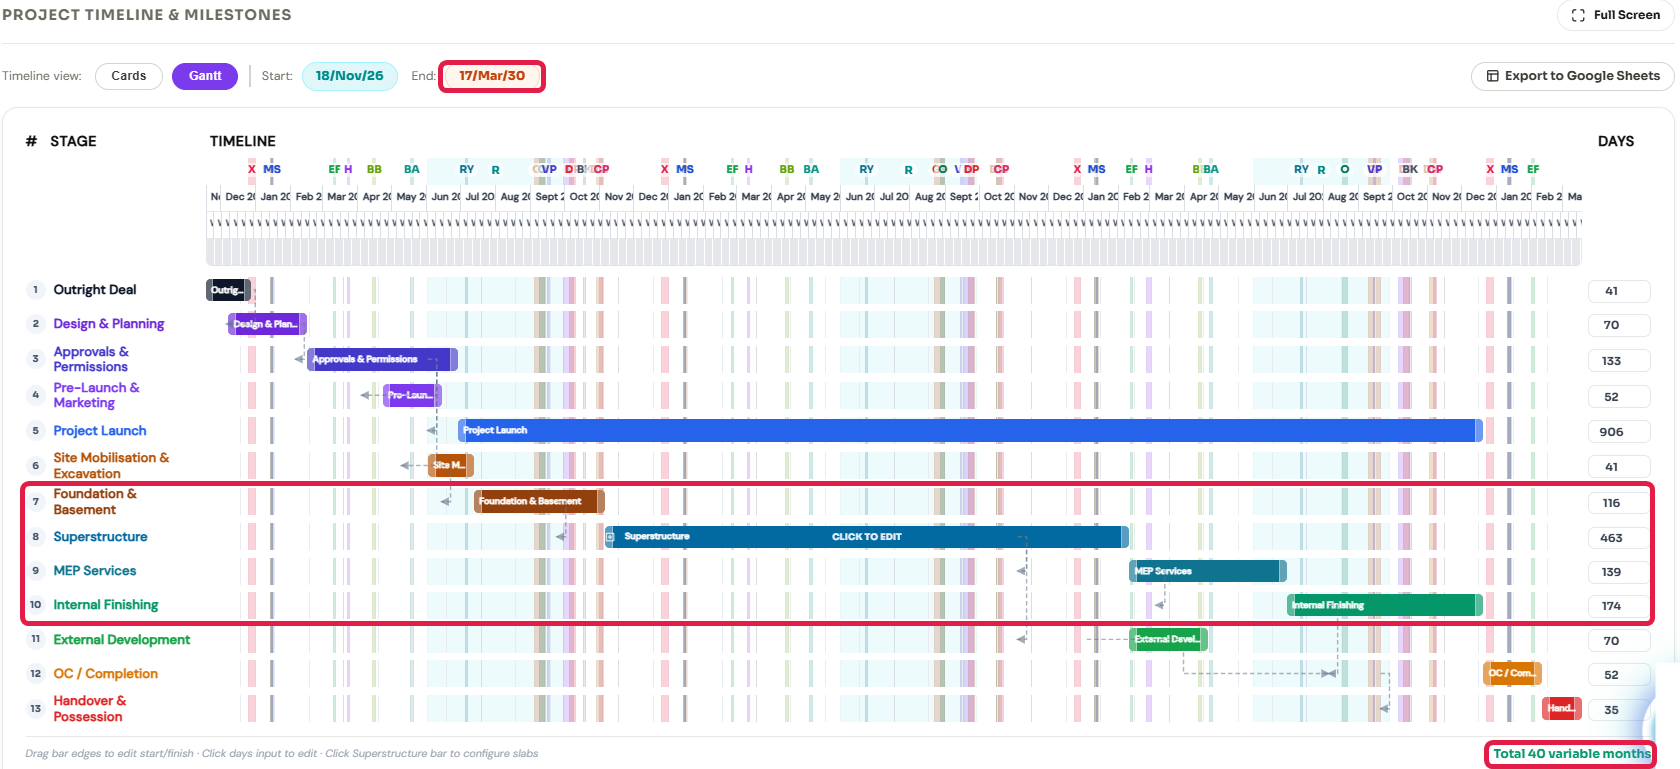
Almost all of the extra 16 months sits in construction. In the FSI Atlas timelines, foundation grows from 70 to 116 days, the superstructure from 278 to 463 days, MEP from 83 to 139 days and internal finishing from 104 to 174 days, and handover moves back with them. A longer build means the developer's money is tied up longer, more months of site overheads and marketing, and more exposure to cost increases before the last flat is sold.
Loan interest is close to zero in both cases. Stage-wise payments from buyers fund most of the construction, so the longer timeline does not show up as interest. Its real cost is cost escalation, slower sales and risk, which a static model only partly captures.
Where the Saving Comes From — Cost per Saleable sq.ft.
| Cost head (₹/saleable sq.ft.) | 4.8 FSI | 8 FSI | Change |
|---|---|---|---|
| Land | 688 | 413 | −40% |
| Government charges | 1,495 | 993 | −34% |
| Construction (incl. parking) | 2,802 | 3,195 | +14% |
| Marketing & sales | 869 | 839 | −3% |
| Consultants and administration | 287 | 280 | −2% |
| All-in cost | 6,141 | 5,720 | −7% |
This is the heart of it. The land, TDR and premium bills are largely fixed, so spreading them over 67% more floor space saves real money. But the taller building, with two more parking levels, costs 14% more to build per square foot, and that swallows a large part of the saving. The net reduction in cost is about 7%.
At the same selling rate, the 8 FSI project makes ₹174 crore more profit than the 4.8 FSI project. Whether any of that reaches the buyer is the question we come back to at the end.
The Landowner Moves Next
The study so far holds the land price constant. In practice, the moment a plot can carry 8 FSI instead of 4.8, its owner knows it is worth more. Land is priced on what can be built on it.
| Base land price (8 FSI case) | Land acquisition | Total cost | Profit at ₹13,000 | ROI |
|---|---|---|---|---|
| Unchanged (₹20 Cr) | ₹21.90 Cr | ₹303.55 Cr | ₹395.98 Cr | 130.4% |
| +20% (₹24 Cr) | ₹26.01 Cr | ₹307.66 Cr | ₹391.87 Cr | 127.4% |
| +50% (₹30 Cr) | ₹32.58 Cr | ₹314.23 Cr | ₹385.30 Cr | 122.6% |
| For reference, the 4.8 FSI project returns 113.4%. Land acquisition includes stamp duty and brokerage as calculated in FSI Atlas. | ||||
The FSI Atlas negotiation panel shows the same effect live. Raising the base land cost moves the ROI shown in the green Live Verdict pill:
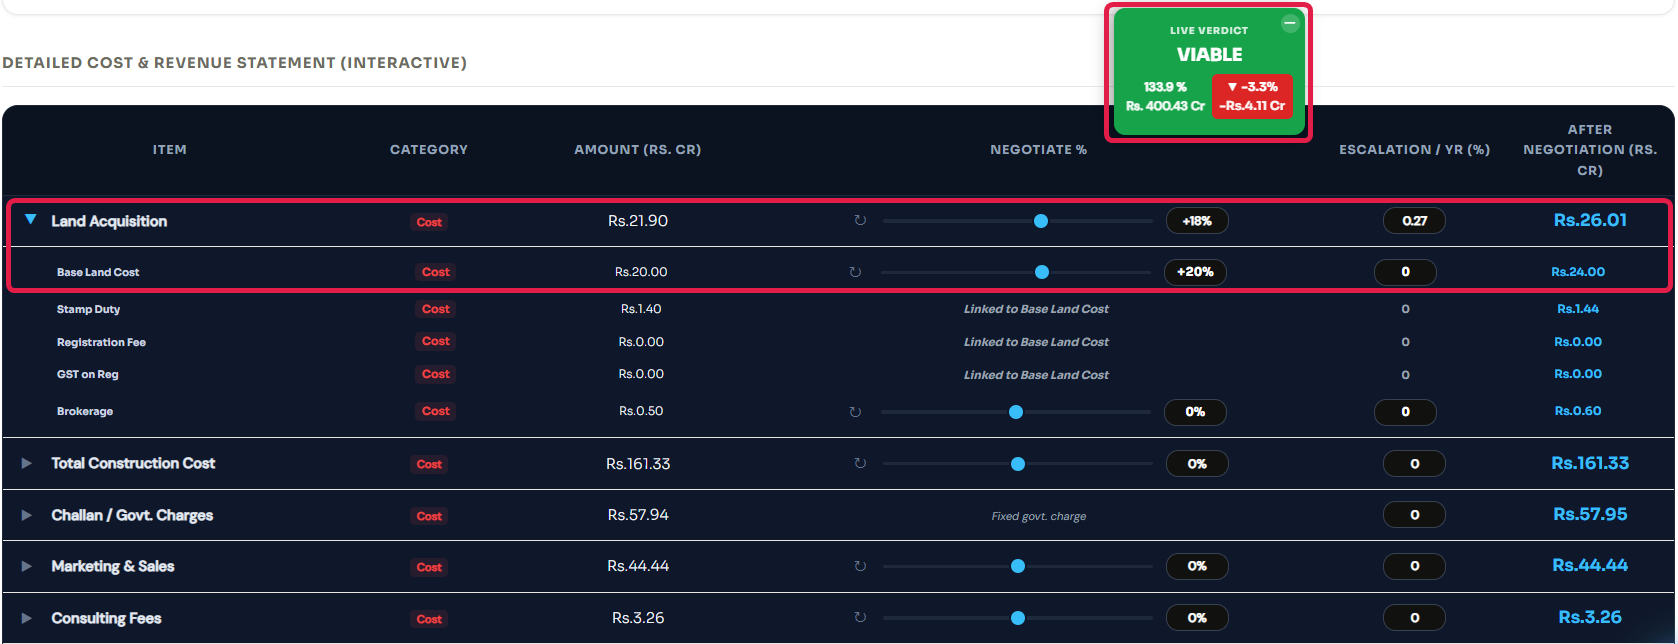
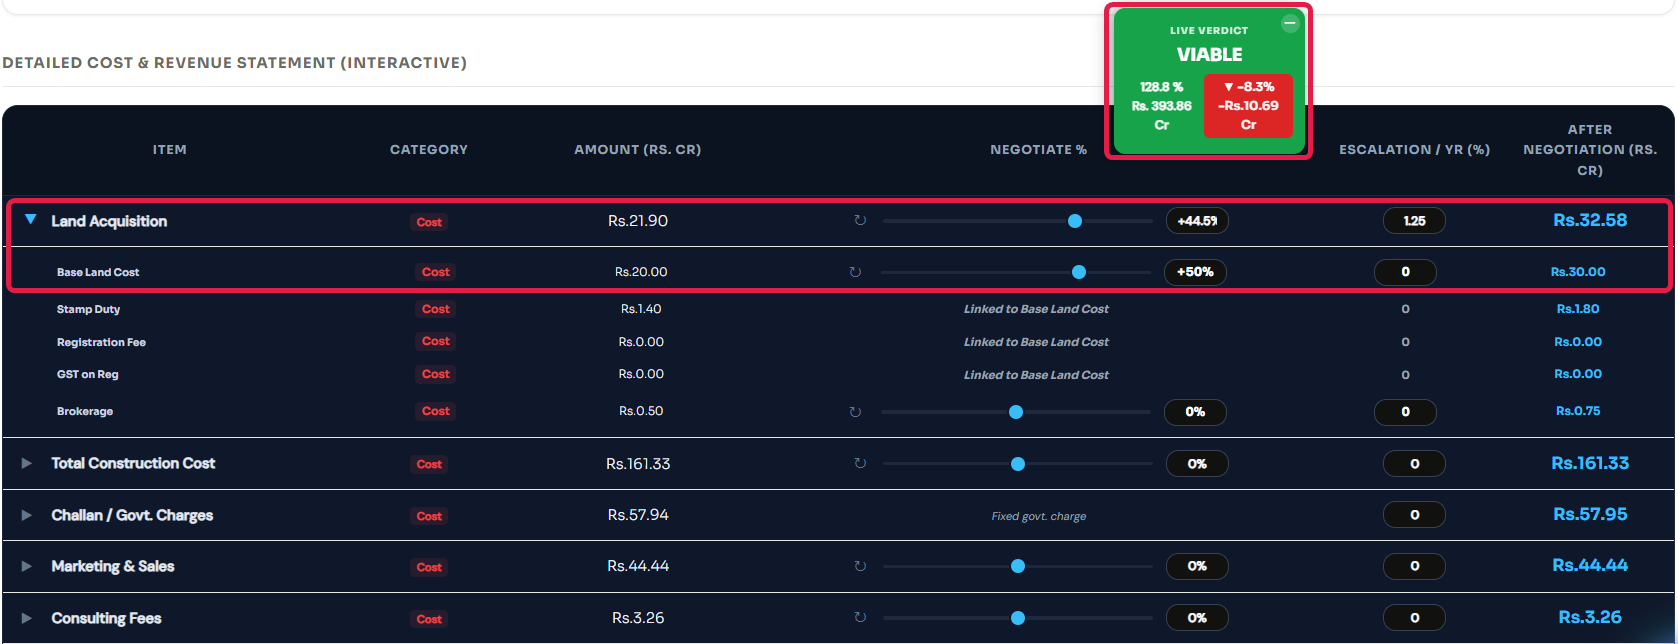
The uncomfortable conclusion. Extra FSI granted free of premium tends to end up in the land price. Unless something else holds land prices down, the landowner can capture most of the gain that the 8 FSI argument promises to buyers.
What This Study Does Not Include
- Aviation height limits — not applied, deliberately. In many parts of Pune they would make 8 FSI unbuildable.
- Fire charges and fire premium — not included. They rise with building height and would add to the 8 FSI cost.
- Inclusive Housing pricing — the base model sells Inclusive Housing at the market rate. At regulated prices, the 8 FSI case loses more revenue, because its obligation is nearly three times larger.
- Escalation and absorption — construction cost escalation over a longer timeline, and slower sales of 67% more flats in the same location, are not modelled.
- Mumbai specifics — DCPR 2034 has a different FSI structure, premium regime and land market. The direction carries over; the numbers do not.
If the Builder Keeps the Same Margin
How much cheaper could homes be?
Everything above is at the same selling rate of ₹13,000 per sq.ft. Now suppose the builder is content with the same profit margin as the 4.8 FSI project (about 53% of revenue) and passes the rest of the saving to buyers. Then the 8 FSI flat could sell for about ₹11,915 per sq.ft. instead of ₹13,000, which is 8.3% cheaper, or roughly ₹11 lakh less on a 1,000 sq.ft. flat. That holds only if the land price does not move.
At a little more than double the land price (about +113%), the saving disappears and the flat costs ₹13,000 again.
Closing note
On this plot, 8 FSI lowers the all-in cost of a flat by about 7%. The land, TDR and premium bills get spread over more floor space, but the taller building, two extra parking levels and a timeline of 40 months instead of 24 take back a good part of the saving.
The extra FSI also has to come as Basic FSI. Sold as premium, a large part of the gain goes to the authority. Bought as TDR, the project ends up worse than today's 4.8 FSI.
Even then, buyers see a lower price only if two things hold. The builder has to keep the same margin and not the same price, and the landowner must not reprice the land. At a 20% higher land price, the potential cut falls from 8.3% to 6.9%. At 50%, it falls to 4.7%. Without those conditions, 8 FSI mainly raises the builder's profit and the value of the land.
In this project, TDR and premium alone cost ₹39.90 crore whatever the FSI. For affordability, the cost of TDR and premium, approval timelines and land pricing matter at least as much as the FSI number itself.
Frequently Asked Questions
What is the maximum residential FSI under UDCPR today?
On a non-congested plot in a Municipal Corporation with an access road of 30 m or more, UDCPR Table 6-G allows Basic FSI 1.10, Premium FSI 0.50 and TDR 1.40 — a total of 3.00. Ancillary Area FSI of 60% for residential use is calculated on that 3.00 and sits outside the cap, which takes the buildable residential FSI to 4.80. Higher figures appear only in special cases such as TOD zones or the CBD provision of Regulation 7.13, which is meant for commercial development.
What would it take for UDCPR to allow 8 FSI for housing?
With 60% ancillary FSI for residential use, 8.00 needs 5.00 before ancillary. If Premium FSI (0.50) and TDR (1.40) stay as they are, Basic FSI has to rise from 1.10 to 3.10, and the 3.00 cap in the road-width table has to rise to 5.00. Raising Basic FSI alone does nothing if the cap is not lifted with it.
Does 8 FSI make homes cheaper?
Only modestly, and only under conditions. In our Pune test the all-in cost per saleable sq.ft. fell by about 7%, from ₹6,141 to ₹5,720. If the developer keeps the same profit margin, the selling price could fall from ₹13,000 to about ₹11,915 per sq.ft. — roughly 8%. At an unchanged selling price, the developer's profit rises by about ₹174 crore instead.
What happens if the landowner raises the land price after FSI goes up?
The benefit shrinks fast. With a 20% higher land price, the price needed to hold the developer's margin rises to about ₹12,099 per sq.ft. (about 7% below today). At 50% it is about ₹12,394, and at a little more than double the land price the entire benefit to buyers is gone. Higher FSI tends to be captured in land value unless something else controls the land price.
Why was this tested in Pune and not Mumbai?
The 8 FSI idea was made for Mumbai, which is governed by DCPR 2034 with its own FSI structure. Rather than force Mumbai's rules into a different framework, we asked a parallel question in the regulation FSI Atlas models end to end — UDCPR 2020 — using a Pune Municipal Corporation plot. The economics carry over in direction, but the Mumbai figures would differ.
What does this study not include?
It does not apply aviation height limits, it does not include fire-related charges or fire premium, it holds the selling rate and ASR constant in both cases, it prices Inclusive Housing at the market rate as the base model does, and it does not model construction cost escalation or slower sales from a larger project. Each of these would move the numbers, mostly against the 8 FSI case.
References and Sources
- Unified Development Control and Promotion Regulations for Maharashtra State — Government of Maharashtra, Urban Development Department, sanctioned 2 December 2020. Chapter 6 (Table 6-G, FSI for non-congested areas; Ancillary Area FSI) and Regulation 7.13 (additional FSI for commercial development in CBD).
- UDCPR Regulation 3.8 — Inclusive Housing, 20% of Basic FSI for group housing. See our Inclusive Housing guide.
- Annual Statement of Rates (ASR), Department of Registration and Stamps, Government of Maharashtra — the basis for premium, ancillary premium and development charges.
- Development Control and Promotion Regulations for Greater Mumbai, 2034 — for the Mumbai context.
- FSI Atlas feasibility reports for both scenarios, generated 19 November 2026 (study inputs as listed above).
This is a study, not a project feasibility. The 8 FSI scenario is hypothetical and does not exist under UDCPR today. All figures come from a single plot with fixed assumptions. Real projects need site-specific checks for height limits, fire norms, parking design, approvals and market absorption.
